Data Inspector
Basic Usage
The data inspector consists of two graphs: the batch view and the run view. In this document, a run is a single evaluation of a single spike-sorting algorithm on a single extracellular recording, and a batch is a collection of runs that may vary in algorithm, dataset, both, or neither. Initially, only the batch view is shown; click on a data point in the batch view to see the run view corresponding to that run.
Each run produces a set of clusters, each of which is a set of timestamps of identified events. The run view displays those clusters for a particular run, indicating for each cluster how many events correspond to ground truth spikes and how many do not.
To view multiple batches at once, see the aggregate data viewer.
Glossary
Concepts
Channel - A single extracellular electrode’s measurements.
Cluster - One of the groups of events which are outputted by a spike-sorting run. The “main” cluster is the cluster whose events best line up with the ground-truth spikes.
Density - The fraction of channels within a run’s spatial extent which are used by the run. Densities below 1 are used to simulate the effects of having a probe with a smaller physical electrode density.
Event - A point in time in a recording associated by a run with a particular cluster. It is important to distinguish between events and spikes; some spikes are associated with multiple events, while most events are noise and are not associated with any spike.
Ground-truth spike (or just spike) - A point in time in a recording associated with the firing of a patch-clamped neuron, as ascertained from intracellular data. Each spike is either a solo spike or a burst spike, depending on whether it occured as part of a rapid burst of spikes.
Recording - The data across all channels from a single recording session of a multi-channel extracellular probe. In this dataset, each recording has between 50 and 250 channels.
Run - A single execution of a single spike-sorting algorithm on a subset of the channels in a single recording.
Spatial extent - The area covered by the channels used for a run. For example, if there are 20 channels used for a run with a density of 1/3, its spatial extent is 60 channels. In order to give simulated probes the best possible chance at good data, the set of channels within the spatial extent of a run are selected by taking the channels with the largest mean spike amplitude.
Batch view attributes
Precision (“precision_main”) - Of the events in the “main” (winning) cluster, what fraction are aligned with ground truth spikes?
Solo recall (“recall_main_solo”) - Of the ground truth non-bursting spikes, what fraction are aligned with an event in the main cluster?
Burst recall (“recall_main_burst”) - Same but for bursting spikes
Solo detection (“recall_all_solo”) - Of the ground truth non-bursting spikes, what fraction are aligned with at least one event in at least one cluster?
Burst detection (“recall_all_burst”) - Same but for bursting spikes
Solo overdetection ratio (“recall_over_solo”) - Of the ground truth non-bursting spikes, what is the average number of events they are associated with?
Burst overdetection ratio (“recall_over_solo”) - Same but for bursting spikes
Solo average precision (“recall_over_solo”) - Of the events associated with a ground truth non-bursting spike, what is the average precision of the cluster they are in? (This is useful as a measure of whether the clustering worked, whether or not they are undermerged.)
Solo-other average precision (“recall_over_solo”) - Of the events associated with a ground truth non-bursting spike which do not have an associated event in the “main” cluster, what is the average precision of the cluster they are in?
Burst average precision (“recall_over_solo”) - same as solo average precision, but for bursting spikes
Burst-other average precision (“recall_over_solo”) - same as solo-other average precision, but for bursting spikes
Run view tags
not-GT - The event is not associated with any ground truth spike.
GT-main-solo - The event is associated with a ground truth non-bursting spike, and the spike is associated with an event in the “main” cluster. (Note that the original event need not be in the main cluster.)
GT-main-burst - The event is associated with a ground truth bursting spike, and the spike is associated with an event in the “main” cluster. (Note that the original event need not be in the main cluster.)
GT-other-solo - The event is associated with a ground truth non-bursting spike, but the spike is not associated with any event in the “main” cluster.
GT-other-burst - The event is associated with a ground truth bursting spike, but the spike is not associated with any event in the “main” cluster.
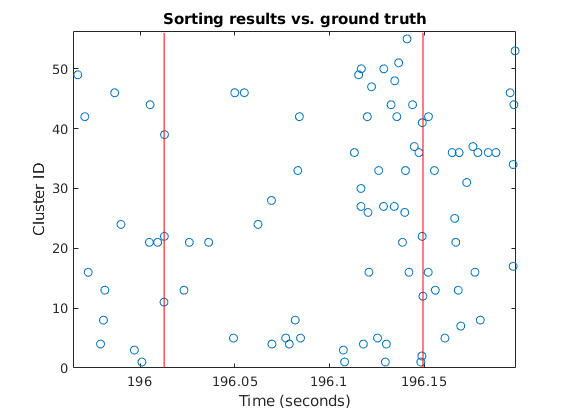
Visualization of the events outputted by an example run, illustrating the fact that often multiple clusters have events representing the same spike. Vertical red lines illustrate ground truth spikes.
The reason for these categorizations is to ascertain, in the event that a non-main cluster has a lot of spike-associated events, whether that cluster is capturing “missed” spikes or whether it is simply duplicating spikes that were already detected by the main cluster.
Suggested Usage
Making the batch view useful can be tricky given there are a lot of parameters. Some recommendations:
Generally speaking, which algorithm is being run on which recording tends to have a much stronger impact than the channel count or density of the run. So if the data is overwhelming, try restricting your view to either contain only one recording or only one algorithm, or put “recording” on the X axis so different recordings are not on top of each other.
Most batches have a clear independent variable (e.g. channelCt, noise, or density). It’s useful to keep the independent variable either on the X axis or as the “fill lightness” parameter.
Solo spikes are much easier to classify and detect than burst spikes, and often the limiting factor for solo spike classification is a different factor than the limiting factor for burst spikes. If you’re viewing one and the data aren’t illuminating, try the other.
When I am reviewing a batch, two graphs I always make (after paging quickly through each attribute crossed with the independent variable) are:
recall_all_burst (X) vs. recall_main_burst (Y) vs. independent variable (fill). Viewing the three variables which tend to change the most, all in one graph, sets the big picture.
recall_main_burst (X) vs. precision_main (Y) vs. independent variable (fill). There is a tradeoff between precision and recall. Viewing both at the same time shows whether changes in one metric represent progression along the tradeoff, or whether they just represent an increase or decrease in quality.
If you are interested in doing any further analysis, you can download the CSV files used to generate these graphs from the batchData folder.